Google Cloud SLO demystified: Uncovering metrics behind predefined SLOs
Google Cloud supports service monitoring by defining and tracking SLO of the services based on their metrics that are ingested to Google Cloud.
This support greatly simplifies implementing SRE practices for services that are deployed to Google Cloud or that store telemetry data there.
To make it even more simple to developers, the service monitoring is able to automatically detect many types of managed services and supports predefined availability and latency SLI definitions for them.
When you define a new SLO you are prompted to select a predefined SLI or to define your own.
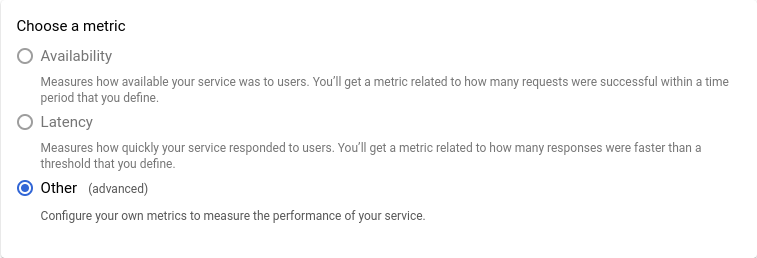
While it is convenient to use predefined SLIs you aren’t provided with information about SLI definitions.
If you already defined an SLO using one of predefined SLIs, you can get its detailed description using the services.serviceLevelObjectives.get API.
For example, the following command returns JSON payload that describes the SLO named availability_slo of the frontend service that was defined using the predefined availability SLI:
curl -X GET \
https://monitoring.googleapis.com/v3/projects/${GOOGLE_CLOUD_PROJECT}/\
services/frontend/\
serviceLevelObjectives/frontend-availability-slo?view=EXPLICIT \
-H "Authorization: Bearer $(gcloud auth print-access-token)" \
-H "Content-Type: application/json; charset=utf-8"
This example uses gcloud CLI and the environment variable GOOGLE_CLOUD_PROJECT.
This variable is automatically set by Cloud Shell.
However, if you run this command in your shell, you will need to install gcloud, then to authenticate vs Google Cloud and to set up the GOOGLE_CLOUD_PROJECT environment variable to the project ID where your SLO is defined.
The following paragraphs describe predefined SLIs to enable you to make an educated choice next time you use them.
Managed (auto-detected) services
The managed services generate metrics that are further used to calculate predefined SLIs. The service monitoring automatically detects these managed services or the user can provision them manually. As long as the service is defined as one of the basic services and uses one of the following types, it can leverage the predefined SLIs.
APP_ENGINE– Every deployed application is considered a service. This service can be monitored using multiple ways including SLOs.ISTIO_CANONICAL_SERVICE– When vanilla Istio is configured to ingest its metrics to Cloud Monitoring, its services are auto-detected as Istio canonical services. GKE workloads that leverage the managed version of Istio (aka ASM) do not use this type.CLUSTER_ISTIO– Services that run on GKE with ASM are identified as Cluster Istio services. Note that since ASM supports Kubernetes clusters on Azure and AWS you can implement service monitoring for these clusters as well.CLOUD_RUN– Cloud Run services are auto-detected using this type. Important to remember that service monitoring does not support Cloud Run jobs.
Important
Not all services that Service monitoring automatically detects, have predefined SLIs.
For example, services of types GKE_SERVICE or GKE_WORKLOAD do not have predefined SLIs (because they do not ingest any metrics to Google Cloud).
Predefined SLIs
All predefined SLIs are measured in % and calculated based on the well known formula of
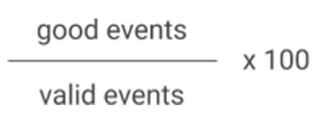
The predefined SLIs use a resource type and a metric to get the event data. The availability metric is used to get availability events and the latency metric is used to get latency events. From all metric data the good events are derived using a good service filter and valid events – using the union of good service filter AND bad service filter. The filters are built using metric labels and leverage the fact that both availability and latency metrics have the same set of labels. You can use the following MQL query to see the valid events:
fetch %%resource%%
| metric '%%metric%%'
| filter (%%good_service_filter%%) || (%%bad_service_filter%%)
And this MQL query to see the good events:
fetch %%resource%%
| metric '%%metric%%'
| filter %%good_service_filter%%
Note
You will have to replace values enclosed with double percentage (%%) with the actual values of the predefined SLIs.
AppEngine service
Detects both standard and flexible AppEngine services.
-
Resource type: gae_app
-
Availability metric:
appengine.googleapis.com/http/server/response_count -
Latency metric:
appengine.googleapis.com/http/server/response_latencies -
Good service filter:
resource.module_id = 'MODULE_ID' &&
metric.response_code >= 200 && metric.response_code <= 299
Note
MODULE_ID should be replaced with the actual AppEngine service/module name. See gae_app resource description for more information.
-
Bad service filter:
resource.module_id = 'MODULE_ID' &&
metric.response_code >= 500 && metric.response_code <= 599
Canonical Istio service
Detects Istio services provisioned by OSS Istio.
-
Resource type: istio_canonical_service
-
Availability metric:
istio.io/service/server/request_count -
Latency metric:
istio.io/service/server/response_latencies -
Good service filter:
resource.mesh_uid = 'MESH_ID' &&
resource.namespace_name = 'K8S_NAMESPACE' &&
resource.canonical_service_name = 'K8S_SERVICE_NAME' &&
metric.response_code >= 200 && metric.response_code <= 299
Important
MESH_ID should be replaced with the identifier for an Istio service mesh. K8S_NAMESPACE should be replaced with the namespace where the service is manifested. K8S_SERVICE_NAME should be replaced with the name of the canonical service. See istio_canonical_service resource description for more information.
-
Bad service filter:
resource.mesh_uid = 'MESH_ID' &&
resource.namespace_name = 'K8S_NAMESPACE' &&
resource.canonical_service_name = 'K8S_SERVICE_NAME' &&
metric.response_code >= 500 && metric.response_code <= 599
ASM service
Detects the managed flavor of the Istio service. Used with Istio services provisioned by ASM, hence uses a different resource type.
-
Resource type: k8s_container
-
Availability metric:
istio.io/service/server/request_count -
Latency metric:
istio.io/service/server/response_latencies -
Good service filter:
resource.cluster_name = 'CLUSTER_NAME' &&
resource.location = 'LOCATION' &&
resource.namespace_name = 'K8S_NAMESPACE' &&
metric.destination_service_namespace = 'K8S_NAMESPACE' &&
metric.destination_service_name = 'K8S_SERVICE_NAME' &&
metric.response_code >= 200 && metric.response_code <= 299
Important
CLUSTER_NAME should be replaced with the name of the cluster running the service. LOCATION should be replaced with the location (either zone or region) of the service. K8S_NAMESPACE should be replaced with the namespace where the service is manifested. K8S_SERVICE_NAME should be replaced with the name of the service. See k8s_container and the metric descriptions for more information.
-
Bad service filter:
resource.cluster_name = 'CLUSTER_NAME' &&
resource.location = 'LOCATION' &&
resource.namespace_name = 'K8S_NAMESPACE' &&
metric.destination_service_namespace = 'K8S_NAMESPACE' &&
metric.destination_service_name = 'K8S_SERVICE_NAME' &&
metric.response_code >= 500 && metric.response_code <= 599
Cloud Run service
Detects a service deployed at Cloud Run.
-
Resource type: cloud_run_revision
-
Availability metric:
run.googleapis.com/request_count -
Latency metric:
run.googleapis.com/request_latencies -
Good service filter:
resource.service_name = 'SERVICE_NAME' &&
resource.location = 'LOCATION' &&
metric.response_code_class = '2xx'
Important
SERVICE_NAME should be replaced with the name of the Cloud Run service. LOCATION should be replaced with the region where the service is deployed. See cloud_run_revision for more information.
-
Bad service filter:
resource.service_name = 'SERVICE_NAME' &&
resource.location = 'LOCATION' &&
metric.response_code_class = '5xx'
Afterword
The predefined SLIs are used with the “request-based” SLOs. This is because the auto-detected services communicate using requests. If you use the services differently or, in your case the metrics used in the predefined SLIs do not reflect good and valid events correctly, use custom SLI for your availability and latency SLOs.
The shown filters values use syntax that is compatible with MQL. If you plan to reuse them in custom SLIs with Terraform or by calling API, you should reformat it. The main changes include replacing && with AND, changing the keys of the labels by adding label suffix (e.g. metric.response_code will become metric.label.response_code). Look into documentation for more guidelines.
This material was prepared with help from Ethan Truong.