How to Securely Connect ADK Agents to Models on Cloud Run
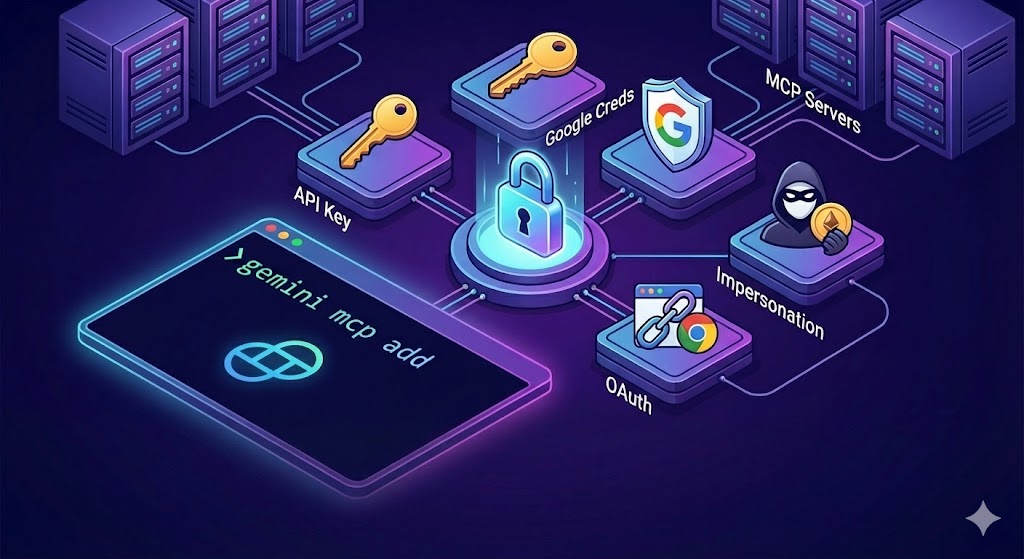
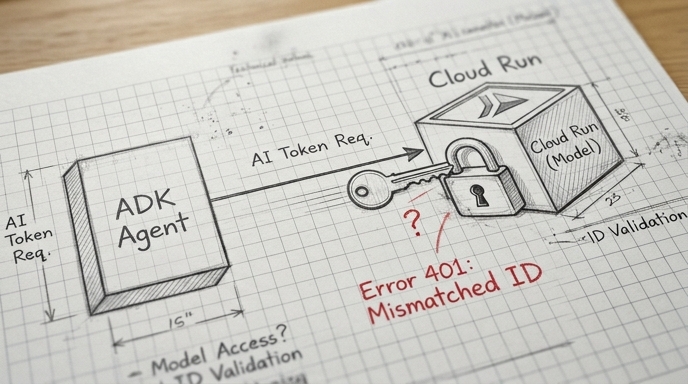
The Agent Development Kit (ADK) simplifies authentication for agents and tools, but is more challenging with the LiteLLM connector when accessing models hosted on Cloud Run. This guide explores how to acquire Google-signed OpenID (ID) tokens and inject them into the LiteLLM communication channel using ADK.
Google Cloud Run provides a robust, built-in access control mechanism based on enforced authentication and IAM policies. When it is enabled, only calls that are made by authenticated accounts which have the specific Cloud Run Invoker role, are accepted, protecting your service from unauthorized invocations.